Lab 4: Finding memory errors with Valgrind
In this lab, you’ll use Valgrind, a memory error checker, to identify memory management mishaps in programs involving arrays and linked lists. Valgrind is ubiquitous in systems programming workflows, especially for programs written in C and C++. You’ll find it valuable for PA 2 and onward, too!
Lab 4 learning objectives
- Recognize the purpose of Valgrind in C programming
- Interpret output from Valgrind for memory-related problems
- Recognize Valgrind outputs for direct leaks, indirect leaks, use after free, and double free
- Use Valgrind to guide memory error fixing
Table of contents
- Icebreaker
- Help! My program leaks…
- Valgrind on Arrays
- Valgrind on Linked Lists
- Valgrind and uninitialized values
- Next steps: Review Quiz
Icebreaker
If you could only eat one meal for the rest of your life, what would it be?
Please write the answers of yourself and one of your group members in your lab report. No check-off is needed!
Help! My program leaks…
Please clone the GitHub repository for this lab’s starter code onto your ieng6 account. It contains code for a few programs that leak memory, and in this lab, we’ll use Valgrind to detect these leaks and help fix them.
Let’s start with leak.c:
$ gcc leak.c -g -Wall -o leak
Remember -g from last week? This flag instructs GCC to add debugging symbols to the compiled executable. These symbols enable GDB to look up and show your source code during debugging. They also enable Valgrind to show you line numbers in its error backtraces.
Take a moment to review leak.c and predict what it should print, then run ./leak. Although running the program gives no visible errors, the program actually produced some memory leaks as a result of us not properly freeing the allocated memory. The Valgrind program allows us to see how much memory is still being used when the program exits, and therefore leaked. Like with GDB, you pass in the program to inspect as an argument to valgrind. We also add the --leak-check=full flag to instruct Valgrind to report the locations where leaked memory had been allocated:
$ valgrind --leak-check=full ./leak
Valgrind provides a “heap summary” of how much memory is still being used at exit, and a “leak summary” which details the different types of leaks that have occurred. When Valgrind reports anything in a leak summary, that means you have a memory leak! Memory leaks are especially harmful in long-running programs, where the amount of available memory gradually reduces over a long time, thereby also reducing the overall performance of the program or the computer in general.
Because we supplied the --leak-check=full flag, Valgrind also printed the stack trace at the instant where each chunk of leaked memory was allocated. You might be inclined to think that the problem lies around the line number it references, but this is usually not the case! Valgrind is just pointing out where the leaked memory got allocated. You, the programmer, decide where it is supposed to be freed. Sometimes, the appropriate place for a free call can be far away from its malloc call in your source code.
Valgrind on Arrays
Now let’s put what you’ve learned into practice. In the lab repository, leak.c and losing_track.c have memory leaks. Try to identify and fix the problems in each program. Feel free to work with those around you!
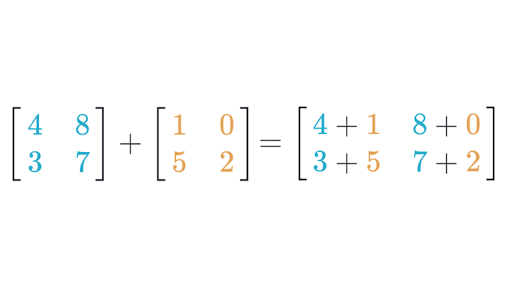
In leak.c, there is a function that performs matrix addition on two 2D arrays. While the functionality may appear correct, a run of valgrind will tell you that memory isn’t freed properly. For reference, here is a diagram of how matrix addition works:
Ask a tutor or TA to check your fix for leak.c along with Valgrind’s output, which should state that “All heap blocks were freed”. Put a screenshot of Valgrind’s output for leak.c into your lab report.
In losing_track.c, there is a function that returns the lower-cased version of the query string of a url without modifying the original string. This is the portion after the question mark in http urls that are often used to specify parameters for a website. We want to return this portion without modifying the original URL. Like previously mentioned, this function appears to work properly, but does not manage memory properly. This error is particularly nasty because this implementation loses track of its allocated memory. Let’s take a deeper look into what this means.
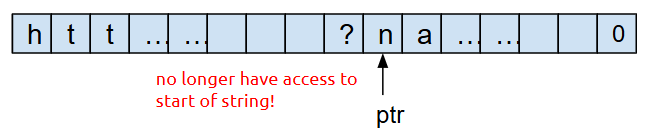
When we first initialize query, we point to the beginning of the string, and therefore have access to our whole chunk of memory. Our memory looks like this:
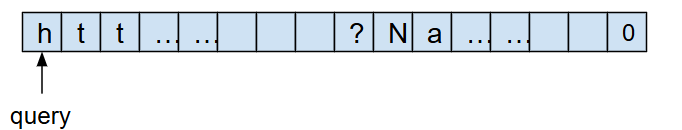
However, after we convert the string to lower case, use ptr to traverse through the string, and return ptr, we no longer have access to the beginning of the string, and therefore can’t free the chunk of memory!
Describe the problem and how you would fix it. Please feel free to work with your teammates together on this. Given time, you may implement the solution and check your work however implementing your solution is OPTIONAL. If you would like to implement your your solution, note that given this is a very involved change, please modify the method as much as you like!
HINT: the problem of the current implementation is that in the string we return, we don’t keep track of the beginning of the string. How can you change this code so that the string we return has its pointer pointing to the beginning?
Ask a tutor or TA to check your interpretation of the problem and solution for losing_track.c. Write your description of the problem and solution for losing_track.c in your lab report.
Valgrind on Linked Lists
As we prepare for PA 2, let’s see how Valgrind can help us discover memory problems surrounding linked list implementations. Compile list.c and run it with Valgrind using the same flags from above. In this case, it should report that 32 bytes of memory have been leaked. Follow the stack trace shown by Valgrind to contextualize yourself with the “story” of the lifetime of this chunk of memory. When did it get allocated? When do you think it should’ve been freed? How can you fix it?
A common misconception is that we can free memory by redirecting pointers to that memory to NULL, the null pointer. You can draw a memory diagram to see that this won’t actually free that memory. Edit list.c so that the main function calls free_list instead of setting ourlist to NULL. Did this fix the leak?
Once you recompile and re-run with Valgrind, you should see a different error: Invalid read of size 8. This time around, Valgrind has a richer story to tell about this chunk of memory. Read the series of backtraces from the bottom line upward to see the events that took place in chronological order along with where they were triggered. Use this story to help understand the nature of the memory problem and figure out how to fix it. You can also pull out GDB if you’d like.
Once you fix this error, ask a tutor or TA to check your fix. Then, re-compile and re-run the list program with Valgrind, and make sure that Valgrind reports no errors and that “no leaks are possible”. Put a screenshot of its output into your lab report.
This is an example of “use after free”, accessing a chunk of memory after you have freed it. The program might still have worked prior to your most recent fix, but because it accessed and relied on data inside a chunk of memory after it was freed, the program was subject to undefined behavior—it could crash, corrupt other memory it owns, or do whatever it wants! Thankfully, Valgrind can detect most instances of undefined behavior and help you eliminate it.
“Double free” is a specific kind of “use after free” where a program tries to free a chunk of memory that has previously been freed. Let’s see how Valgrind reports instances of “double free”. Duplicate the call to free_list in main, and recompile and rerun it with Valgrind.
In addition to Invalid read of size 8, where free_list attempts to access the next member of a freed node, Valgrind also reports Invalid free() / delete / delete[] / realloc() arising from the first free() call inside free_list. Now you know!
Valgrind and uninitialized values
Another source of undefined behavior is reading from uninitialized memory. Valgrind can detect this, too! Compile writesong.c using the same flags as above, but now, run Valgrind with the following:
$ valgrind --track-origins=yes ./writesong
The program should write a simple song to mysong.txt using file I/O operations you will also encounter in PA 2. However, Valgrind reports several instances of “Conditional jump or move depends on uninitialised value(s)” and “Use of uninitialised value”, and because we included the --track-origins=yes flag, it shows us where each uninitialized value was declared. The reports seem to repeat, indicating that an uninitialized value was used in a loop. Read the contents of writesong.c to figure out the problematic variable and initialize it properly. Verify that Valgrind no longer reports these errors when you run the program.
Put a screenshot of Valgrind’s output for ./writesong into your lab report. No need to have a tutor/TA check it—you should now be able to tell if you’ve fixed the memory problem on your own! Remember to submit your lab report to Gradescope.
As we have seen, Valgrind is useful for discovering memory bugs in your program. This will be especially useful in PA 2, where you will be graded on proper memory management as you query and sort your linked list and array. Alongside Valgrind, we cannot understate the usefulness of drawing memory diagrams in helping you reason about memory management and fix memory issues, especially for linked lists. They make memory management much more intuitive, so embrace them!
Next steps: Review Quiz
As usual, we have a fresh Review Quiz for you this week. This Review Quiz will help you with parts of PA 2 and prepare you for the midterm next week.